Strategy
Part of Getting media relations right the first time
Media relations benchmarks: what a realistic number actually measures
media relations benchmarks compare relevance, response, source access, accuracy, public understanding, and business outcomes with stable definitions and limits.
What to take away
- No universal media relations benchmark exists. A benchmark measures one decision stage under a definition the team can restate.
- Typical working rangespitch response from the low single digits to about 20 percent on a targeted list, and a median acknowledgement between one business day and 48 hours.
- Every figure needs five fieldspopulation, period, inclusion rules, calculation and currency.
- Report medians and ranges beside raw counts, because one large story can move an average and hide the pattern.
What a media relations benchmark actually measures
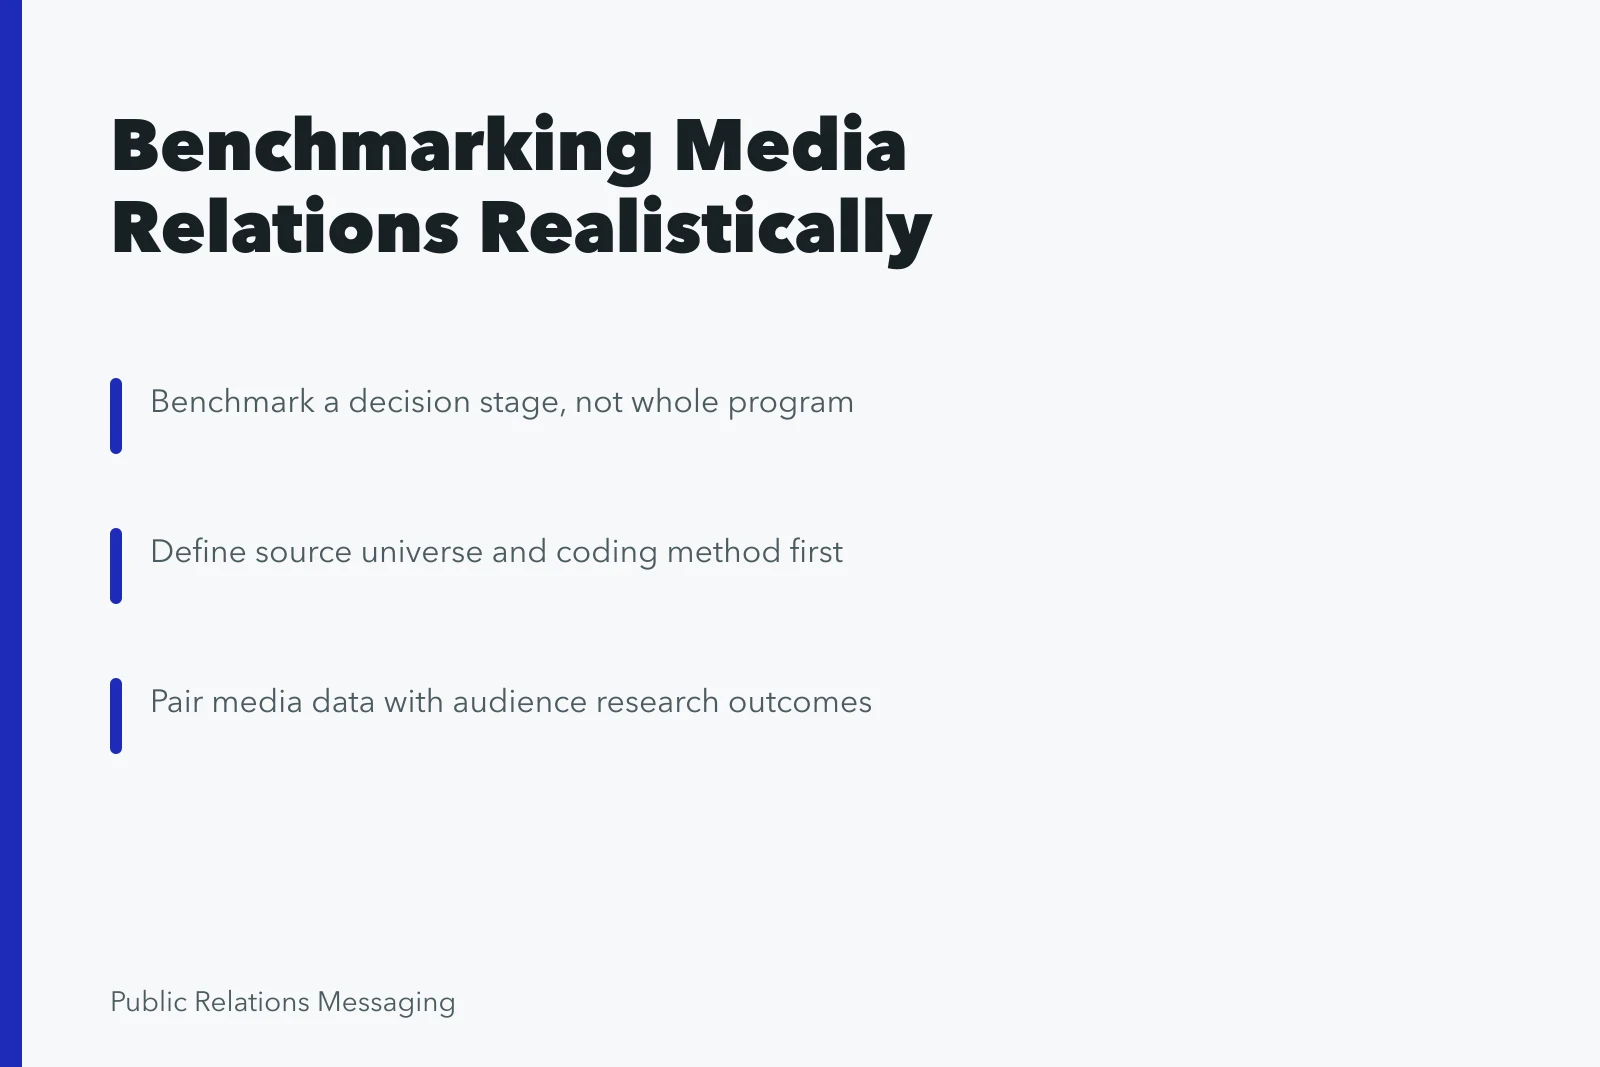
A benchmark is a reference point for one decision, not a grade for a program. Response rate, acknowledgement speed, coverage accuracy and audience understanding sit at different stages. Each answers a different question.
Media relations goes wrong when teams compare a front-stage number against a back-stage one. Matching the layer to the decision matters more than matching the metric name.
A layered set keeps the stages apart. Research and service sit at the front, output and quality in the middle, outtake and outcome at the back, with risk tracked alongside. AMEC's evaluation framework draws the same line between outputs, outtakes and outcomes.
Example: a layered benchmark set with working figures
The figures below are illustrative targets for a mid-sized business-to-business program, not industry averages. Adjust them to your list, story type and news cycle.
Layered benchmark set
| Layer | Illustrative target | Definition the target depends on |
|---|---|---|
| Research | 60 to 70 percent of contacts verified current within 30 days | Verification source and date |
| Service | Median acknowledgement in one business day, factual reply in 48 hours | Clock start, stop, business hours, exclusions |
| Access | 80 percent of qualified requests offered a named source | Qualification rule and availability |
| Quality | 90 percent of coded stories accurate on first pass | Codebook, sample size, reviewer count |
| Outcome | 5 to 10 percent of the target audience takes the named action | Attribution design and other causes |
| Risk | Corrections or complaints logged within five days | Severity scale and reporting threshold |
Seven benchmark layers
Layer
- Research
- Relevant contacts
- Service
- Turnaround time
- Access
- Qualified requests
- Output
- Stories, briefings
- Quality
- Accurate context
- Outtake
- Audience understanding
- Outcome
- Qualified action
- Risk
- Correction, complaint
Benchmark
- Research
- Verification source, age
- Service
- Clock start, stop, hours
- Access
- Qualification, availability rules
- Output
- Topic, outlet, completion
- Quality
- Coding guide, reviewers
- Outtake
- Population, instrument, timing
- Outcome
- Attribution, alternatives
- Risk
- Severity, threshold
Definition
- Research
- Service
- Access
- Output
- Quality
- Outtake
- Outcome
- Risk
Four steps keep the set honest.
Layered benchmark set
- Pick a representative period, ideally twelve months or two full news cycles.
- Record raw counts beside every rate.
- Log launches, leadership changes, tracking outages and source constraints.
- Retire a comparison when the definition or the monitored universe changes.
The coding and sampling decisions behind each layer are set out in PR measurement, which is the place to start if a reviewer asks how a number was built.
Why one rate covers very different programs
Outlet mix, story type, geography, language, paid support and monitoring coverage all move the number. A specialist program graded against a generic average looks weak for reasons unrelated to its outreach. The comparison group, not the program, usually explains the gap.
Take the common case. Response runs low, but the five reporters who matter engage every time. Optimizing for a mass average would make that worse, and the average is the wrong target when the audience is narrow.
If coverage is accurate and the intended audience is still confused, the explanation or the destination page is the problem, not the pitch.
Publicly released survey claims need enough method detail for independent review, per the AAPOR disclosure standards. A PR survey does not clear that bar because a few details appear.
A weak acknowledgement handoff is the usual bottleneck, and diagnosing a weak media relations handoff costs less than buying more outreach.
Making a benchmark comparison valid
Five fields make a figure reproducible: population, period, inclusion rules, calculation and currency. Add the maturity window and the uncertainty around the estimate. Then recalculate the number from the cited source and log any mismatch. Write the five fields down before the first comparison, not after a disagreement.
The GAO evaluation design guide ties an evaluation question to the evidence it needs. The same order applies here: choose the design after the question, never before.
The NIST design selection guidance starts from the objective and the practical constraints. That is the right sequence for deciding whether you need a reported benchmark or a controlled estimate. Observational benchmarks describe what happened, not what caused it.
A benchmark is useful only once the local team explains why the comparison group and the method fit the decision. A media relations checklist should record population, period and calculation rules before anyone compares results.